Free Access
Fig. 5
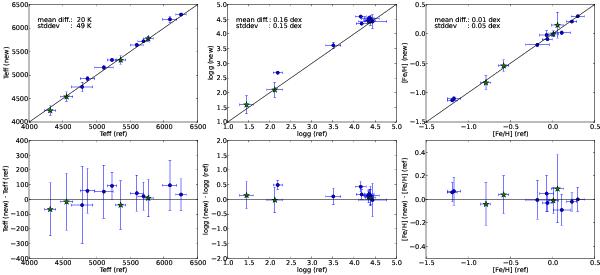
Comparison between the derived (new) and the reference spectroscopic stellar parameters (ref). The star symbols represent the benchmark stars used to select the lines. The filled squares represent the extra stars used to test the ARES+MOOG method with the new line-list.
Current usage metrics show cumulative count of Article Views (full-text article views including HTML views, PDF and ePub downloads, according to the available data) and Abstracts Views on Vision4Press platform.
Data correspond to usage on the plateform after 2015. The current usage metrics is available 48-96 hours after online publication and is updated daily on week days.
Initial download of the metrics may take a while.