Free Access
Fig. 2
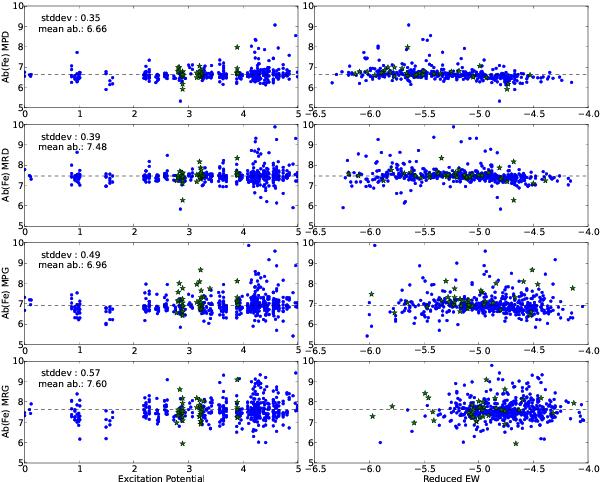
For each benchmark star we present the abundance as a function of excitation potential (left panels) and reduced EW (right panels). Filled circles represent Fe i lines, while the filled stars represent Fe ii lines. For each benchmark star the mean iron abundance and the respective standard deviation are indicated.
Current usage metrics show cumulative count of Article Views (full-text article views including HTML views, PDF and ePub downloads, according to the available data) and Abstracts Views on Vision4Press platform.
Data correspond to usage on the plateform after 2015. The current usage metrics is available 48-96 hours after online publication and is updated daily on week days.
Initial download of the metrics may take a while.