Fig. 5
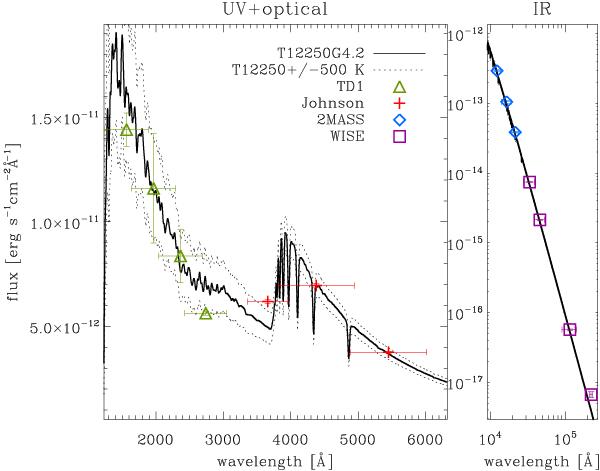
Comparison between LLmodels theoretical fluxes (full line) and TD1 (triangles; Thompson et al. 1995), Johnson (crosses; Mermilliod & Mermilliod 1994), 2MASS (diamonds; Cutri et al. 2003), and WISE (squares; Cutri et al. 2012) photometry converted to physical units. We adopted the calibrations of Thompson et al. (1995), Bessell et al. (1998), van der Bliek et al. (1996), and Wright et al. (2010), respectively. The large deviation of the TD1 photometric point at ~2740 Å is a well-known problem most likely of instrumental origin (e.g., Malagnini et al. 1983; Kjærgaard et al. 1984), and this measurement was not taken into account during the fitting. All the horizontal error bars correspond to the full width at half-maximum of the filter transmission curves. A convolution was applied to the theoretical fluxes for visualisation purposes. Dotted lines show the effect of a 500 K temperature variation in the theoretical fluxes. Note the x-axis logarithmic scale of the right panel.
Current usage metrics show cumulative count of Article Views (full-text article views including HTML views, PDF and ePub downloads, according to the available data) and Abstracts Views on Vision4Press platform.
Data correspond to usage on the plateform after 2015. The current usage metrics is available 48-96 hours after online publication and is updated daily on week days.
Initial download of the metrics may take a while.