Fig. 13
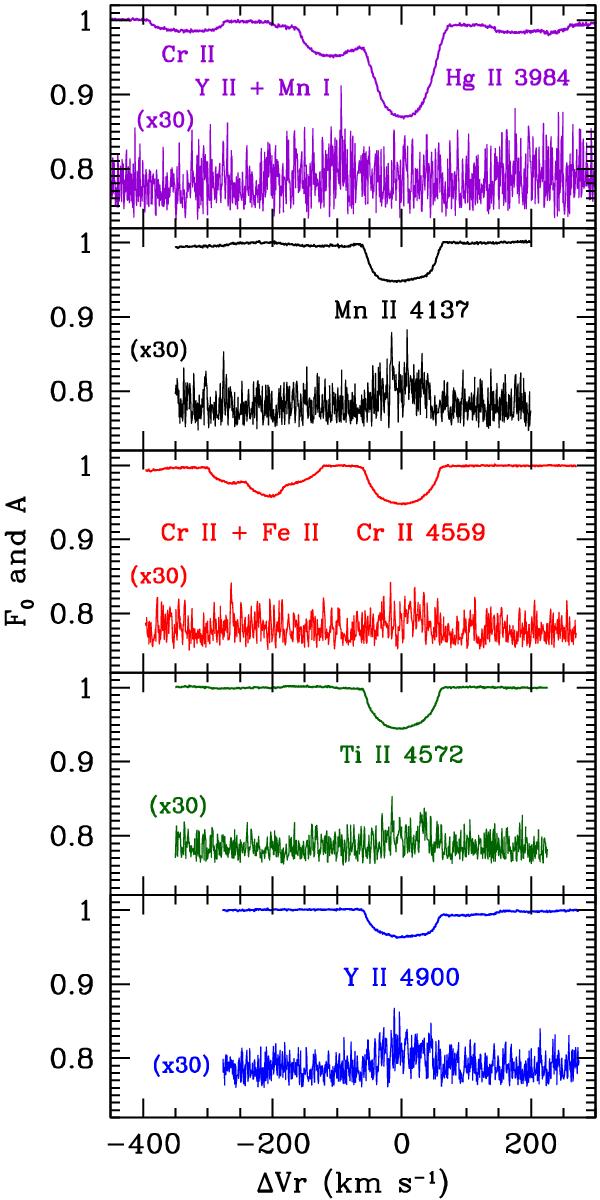
Results of the fitting of the variations affecting a given pixel for a region encompassing the lines shown in Fig. 12. The zero point and the amplitude of the fitting function are shown in each panel. The amplitude is arbitrarily shifted along the ordinate axis and multiplied by 30 for visibility purposes. To allow for a more robust normalisation of Hg iiλ3984, the red wing of Hϵ was used to define pseudo-continuum regions.
Current usage metrics show cumulative count of Article Views (full-text article views including HTML views, PDF and ePub downloads, according to the available data) and Abstracts Views on Vision4Press platform.
Data correspond to usage on the plateform after 2015. The current usage metrics is available 48-96 hours after online publication and is updated daily on week days.
Initial download of the metrics may take a while.