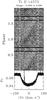
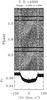
Fig. 12
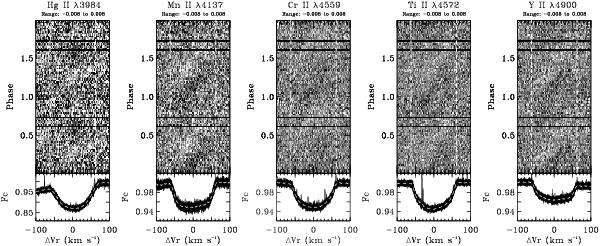
Grey-scale plots of the time series of the residuals for a few selected spectral lines (Hg ii λ3984, Mn ii λ4137, Cr ii λ4559, Ti ii λ4572, and Y ii λ4900) in the case of the HARPS data. The leftmost panel illustrates the distinct behaviour of Hg ii λ3984. (Fig. 13 shows that the variations are not significant.) These residuals (the mean profile subtracted from the individual profiles) were binned to a 0.02 phase interval. A deficit of absorption appears brighter in these plots. The two vertical dashed lines show the velocities corresponding to ±vsini (determined in Sect. 3.2). The lower plots present the superposition of the individual profiles (mean profile overplotted as a dashed line). The spectra are displayed in the stellar rest frame. The cosmic-ray events falling in the line profiles have been removed during the period search (Sect. 3.3).
Current usage metrics show cumulative count of Article Views (full-text article views including HTML views, PDF and ePub downloads, according to the available data) and Abstracts Views on Vision4Press platform.
Data correspond to usage on the plateform after 2015. The current usage metrics is available 48-96 hours after online publication and is updated daily on week days.
Initial download of the metrics may take a while.