Fig. 7
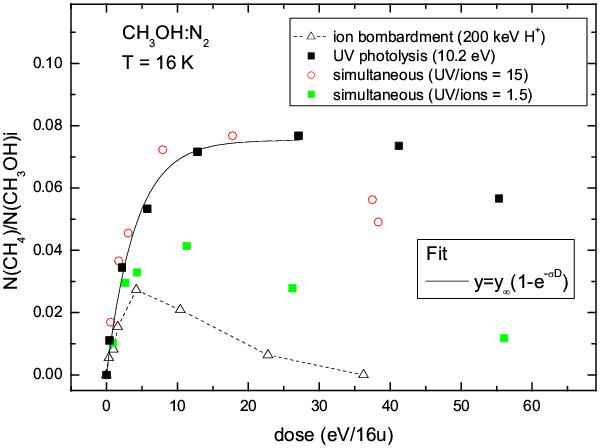
Column density of CH4 formed after processing of CH3OH:N2 mixtures at 16 K. The CH4 column density is normalized to the initial CH3OH column density for each sample. The solid line is the fit of the experimental data relative to UV photolysis by an exponential curve. The dashed line connecting data points relative to ion bombardment has been drawn to guide the eye.
Current usage metrics show cumulative count of Article Views (full-text article views including HTML views, PDF and ePub downloads, according to the available data) and Abstracts Views on Vision4Press platform.
Data correspond to usage on the plateform after 2015. The current usage metrics is available 48-96 hours after online publication and is updated daily on week days.
Initial download of the metrics may take a while.