Fig. 11
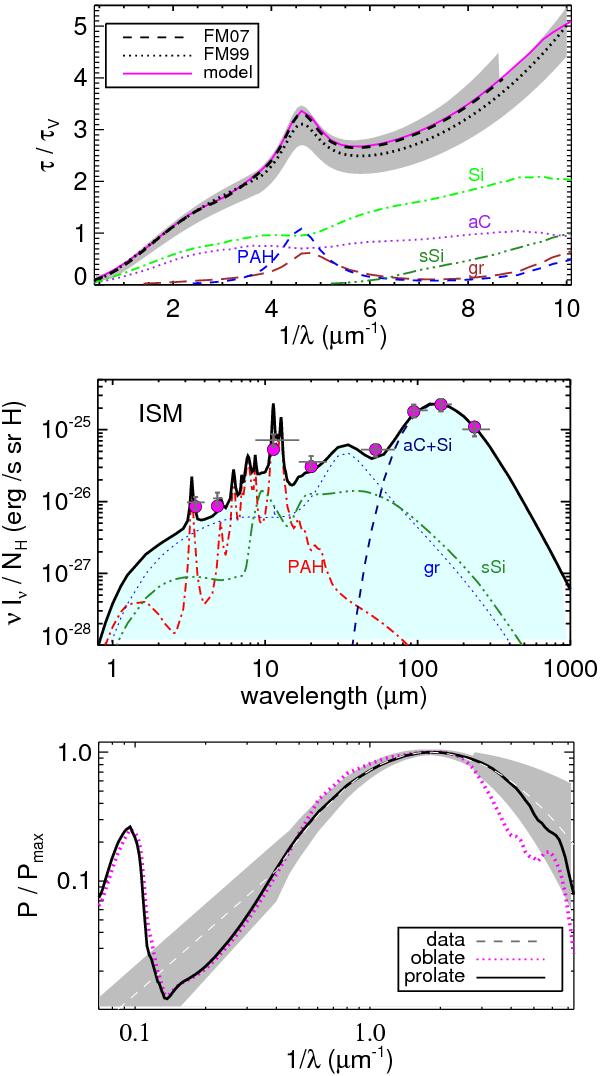
Dust in the solar neighbourhood. The observed extinction curves in the ISM, up to 8.6 μm-1 by Fitzpatrick (1999) and ≤10 μm-1 by Fitzpatrick & Massa (2007), is shown as dashed line and the 1σ variation as hatched area. The contribution of the individual dust components to the total extinction of the model are given with scaled cross sections (Eq. (17)) as magenta line, and unscaled cross sections as dotted magenta line (top). Emission is normalised per H atom when dust is heated by the ISRF. High Galactic latitudes observations from DIRBE (Arendt et al. 1998) and FIRAS (Finkbeiner et al. 1999) with 1σ error bars are shown in grey. The model fluxes convolved with the band passes of the observations are shown as filled circles. The emission of the individual dust components is given. The total emission is shown as black line (middle). The observed linear polarisation normalised to the maximum polarisation as given by Voshchinnikov et al. (2012) is shown as dashed line and 1σ variation as hatched area. The normalised linear polarisation of silicates is shown for prolates as a black line, and oblates as dotted magenta line (bottom).
Current usage metrics show cumulative count of Article Views (full-text article views including HTML views, PDF and ePub downloads, according to the available data) and Abstracts Views on Vision4Press platform.
Data correspond to usage on the plateform after 2015. The current usage metrics is available 48-96 hours after online publication and is updated daily on week days.
Initial download of the metrics may take a while.