Fig. 9
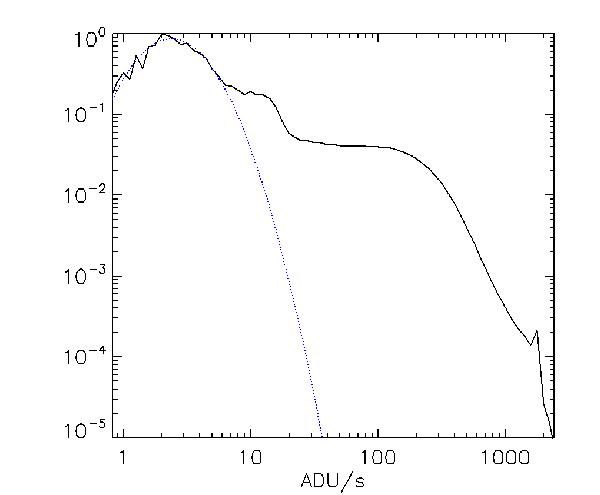
Normalized histogram of the Jul. 2010–Nov. 2012 maps reconstructed by the dark signal model for the image zone. The histogram mode represents the cool pixels. It can be fitted by a lognormal function (blue dotted line), which gives 2.39 ADU pxl-1 s-1 ≈ 4.1 e− pxl-1 s-1. The first small shoulder around 6−20 ADU pxl-1 s-1 comprises the pixels that are polluted by some spurious signal in the bottom of the image. The second shoulder describes the hot pixel dark current distribution. It appears to be flat from 10–20 ADU pxl-1 s-1 to 200 ADU pxl-1 s-1. The hottest pixels deliver 2000 ADU pxl-1 s-1 ≈ 3.5 ke− pxl-1 s-1.
Current usage metrics show cumulative count of Article Views (full-text article views including HTML views, PDF and ePub downloads, according to the available data) and Abstracts Views on Vision4Press platform.
Data correspond to usage on the plateform after 2015. The current usage metrics is available 48-96 hours after online publication and is updated daily on week days.
Initial download of the metrics may take a while.