Fig. 8
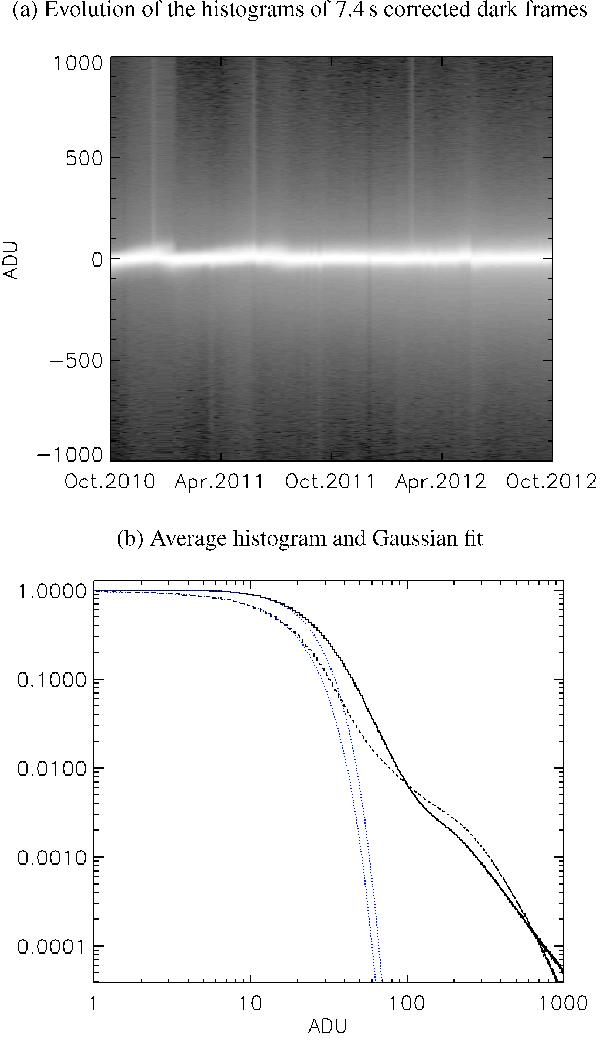
a) Temporal evolution of corrected dark frame histograms. Dark frames with a weekly regularity and T′ = 7.4 s integration time have been selected. Their histogram is coded with a logarithmic gray scale. Most pixels display a corrected signal near zero, as expected. b) Average histogram of all above dark frames. Both axes have log scales. The number of occurrences corresponding to negative signals are represented by the dashed line. The fitted Gaussian function is overplotted with a blue dotted line. Its center (the model bias), its standard deviation (model error), and its full width at half maximum (FWHM) is worth ~3.1 ADU ~14.7 ADU, and ~34.6 ADU, respectively.
Current usage metrics show cumulative count of Article Views (full-text article views including HTML views, PDF and ePub downloads, according to the available data) and Abstracts Views on Vision4Press platform.
Data correspond to usage on the plateform after 2015. The current usage metrics is available 48-96 hours after online publication and is updated daily on week days.
Initial download of the metrics may take a while.