Fig. 7
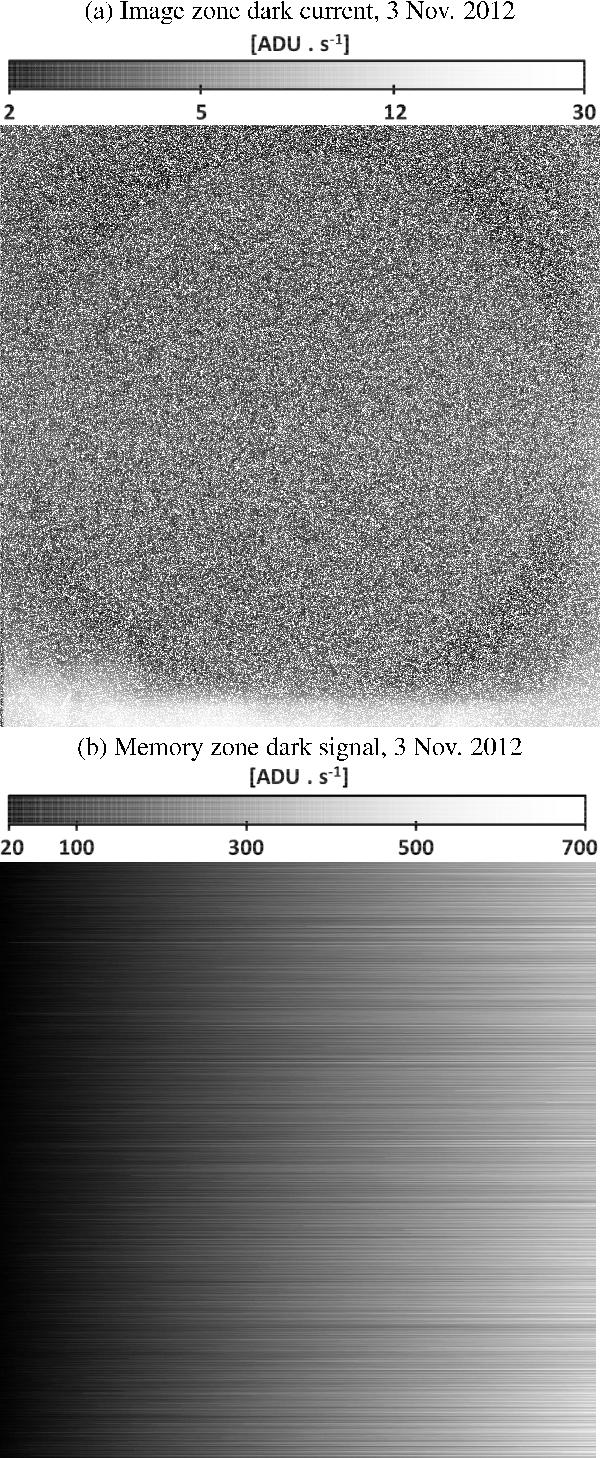
a) DSM dark current in the image zone as of 3 Nov. 2012. The gray scale is logarithmic. Black corresponds to 2 ADU/s and white to 30 ADU/s. At the bottom of the image, one can notice an extended contamination by a spurious signal. Its level is in the 6–20 ADU pxl-1 s-1 range (see also Fig. 9). A persistent solar image is also apparent in the IZ dark current. Its amplitude is about 0.2 ADU pxl-1 s-1. b) Dark signal in the memory zone reconstructed by the DSM as of 3 Nov. 2012. The gray scale is linear and displays the quasi linear increase of the dark signal in MZ (from left to right in this representation). Black corresponds to 20 ADU and white to 700 ADU.
Current usage metrics show cumulative count of Article Views (full-text article views including HTML views, PDF and ePub downloads, according to the available data) and Abstracts Views on Vision4Press platform.
Data correspond to usage on the plateform after 2015. The current usage metrics is available 48-96 hours after online publication and is updated daily on week days.
Initial download of the metrics may take a while.