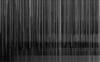
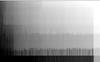
Fig. 6

a) Evolution of the IZ DSM for CCD column (image row) #1341. The log of the IZ DSM is represented in gray scale, and the information from all successive frames has been stacked vertically. The advent of hot pixels in the IZ appears as bright semi-infinite vertical lines. b) Evolution of the MZ DSM for the same CCD column. The representation conventions are the same as above, but in contrast to panel a), the gray scale is linear. The presence or advent of hot pixels in the MZ is seen as steps that brighten the figure rightward and upward simultaneously. The dark current in the MZ appears as an inclined plane, whose slope increases with time due to the gradual emergence of a distribution of hot pixels in the MZ. For both IZ and MZ, the first weeks (bottom of the images) are only poorly estimated because there were no data to feed the DSM/7.4 for these dates.
Current usage metrics show cumulative count of Article Views (full-text article views including HTML views, PDF and ePub downloads, according to the available data) and Abstracts Views on Vision4Press platform.
Data correspond to usage on the plateform after 2015. The current usage metrics is available 48-96 hours after online publication and is updated daily on week days.
Initial download of the metrics may take a while.