Fig. 5
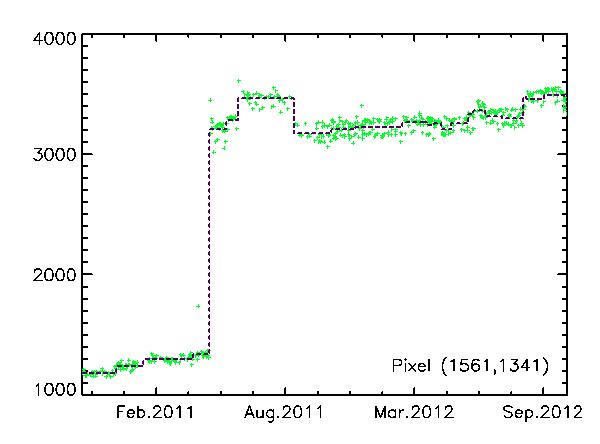
Temporal evolution of the variance-stabilized dark signal (T′ = 7.4 s) in pixel (1561,1341), over-plotted with the piecewise constant fit (dashed line) that results from the reconstruction with the unbalanced Haar technique. This represents a vertical cut in Fig. 4a and the corresponding one in Fig. 4b. Note that the dark signal oscillates between two values after the pixel has become hot. This multi-level random telegraph noise is expected (cf. Sect. 1.3). The drop in dark current observed in this curve around August 2011 also illustrates and demonstrates that hot pixels cool down sometimes, even if they do not recover fully.
Current usage metrics show cumulative count of Article Views (full-text article views including HTML views, PDF and ePub downloads, according to the available data) and Abstracts Views on Vision4Press platform.
Data correspond to usage on the plateform after 2015. The current usage metrics is available 48-96 hours after online publication and is updated daily on week days.
Initial download of the metrics may take a while.