Free Access
Fig. B.3
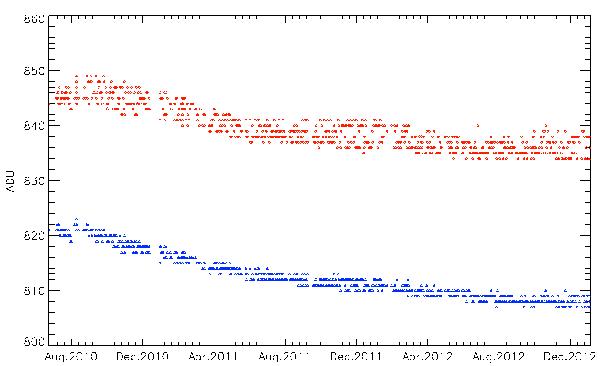
Temporal evolution of the offsets of the left port (red diamonds) and right port (blue triangles) of SODISM CCD from July 2010 to December 2012. The offset value is higher and the spread is broader for the upper time series, which corresponds to the left port.
Current usage metrics show cumulative count of Article Views (full-text article views including HTML views, PDF and ePub downloads, according to the available data) and Abstracts Views on Vision4Press platform.
Data correspond to usage on the plateform after 2015. The current usage metrics is available 48-96 hours after online publication and is updated daily on week days.
Initial download of the metrics may take a while.