Fig. B.1
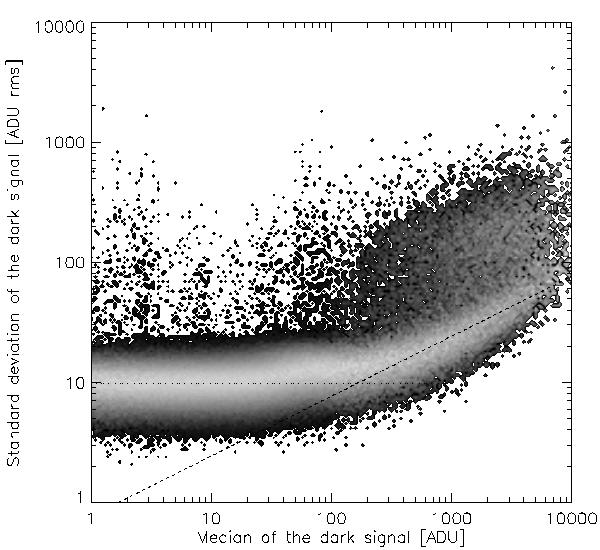
Dark signal transfer plot. The median and standard deviation are computed for every pixel of a series of ten dark frames acquired on 31 July 2010 with Ti = 16.4 s and represented here as a two-dimensional histogram. A region on the left is dominated by the read noise, which amounts to about 10 ADU15 bit rms. The shot-noise dominated region has a slope of 0.5 in the logarithmic representation. Above it, a significant proportion of pixels exhibit ten times more variability than shot noise. These are the hot pixels that suffer from RTS noise (cf. Sect. 1.3).
Current usage metrics show cumulative count of Article Views (full-text article views including HTML views, PDF and ePub downloads, according to the available data) and Abstracts Views on Vision4Press platform.
Data correspond to usage on the plateform after 2015. The current usage metrics is available 48-96 hours after online publication and is updated daily on week days.
Initial download of the metrics may take a while.