Fig. 10
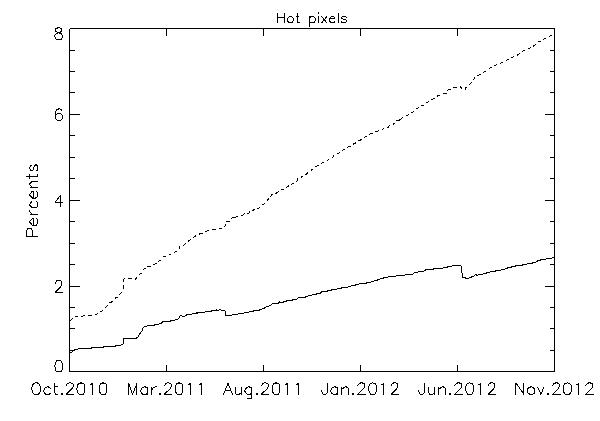
Temporal evolution of the fractional area covered by hot pixels with respect to the whole image zone. The solid line represents hot pixels delivering more than 250 e− pxl-1 s-1, while the dashed line corresponds to warm pixels delivering from 50 to 250 e− pxl-1 s-1. Note the two sudden drops in the otherwise gradual growth of the number of hotter pixels. They occur in mid-June 2011 and mid-June 2012, when 2−3 day bakeouts took place.
Current usage metrics show cumulative count of Article Views (full-text article views including HTML views, PDF and ePub downloads, according to the available data) and Abstracts Views on Vision4Press platform.
Data correspond to usage on the plateform after 2015. The current usage metrics is available 48-96 hours after online publication and is updated daily on week days.
Initial download of the metrics may take a while.