Fig. 9
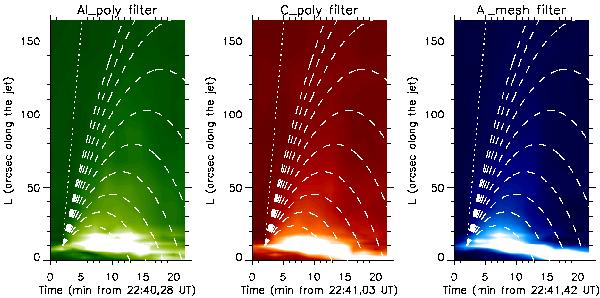
Stack plot for X-ray data relative to the second jet observed during the same time interval with Al−poly (left panel), C−poly (middle panel) and Al−mesh (right panel) filters. Superposed curves show the ballistic trajectories for different initial speeds smaller than the escape speed (dashed lines, see text) and for initial speed equal to the escape speed (dotted line).
Current usage metrics show cumulative count of Article Views (full-text article views including HTML views, PDF and ePub downloads, according to the available data) and Abstracts Views on Vision4Press platform.
Data correspond to usage on the plateform after 2015. The current usage metrics is available 48-96 hours after online publication and is updated daily on week days.
Initial download of the metrics may take a while.