Fig. 1
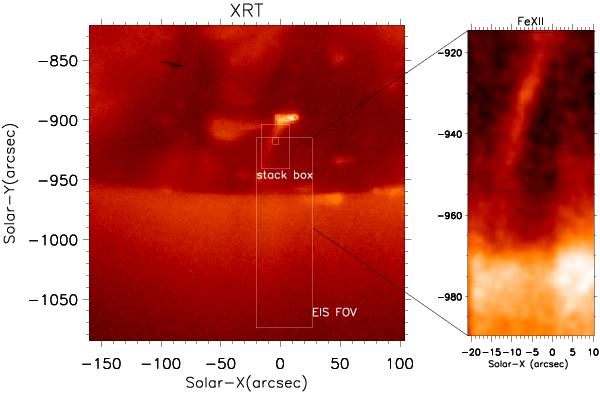
Left panel: XRT image taken using the thin Al−mesh filter at 13:12 UT on April 15, 2007 (jet 1). The large rectangular box marks the EIS FOV corresponding to the 40″ wide EIS slot. Right panel: correspond to an image of the jet as seen in EIS Fe xii. The small square box corresponding to the upper body of the jet is used for light curve analysis. The intermediate size rectangular box in the left panel marks the area used to produce XRT stack plot.
Current usage metrics show cumulative count of Article Views (full-text article views including HTML views, PDF and ePub downloads, according to the available data) and Abstracts Views on Vision4Press platform.
Data correspond to usage on the plateform after 2015. The current usage metrics is available 48-96 hours after online publication and is updated daily on week days.
Initial download of the metrics may take a while.