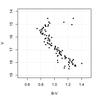
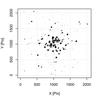
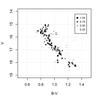
Fig. 5
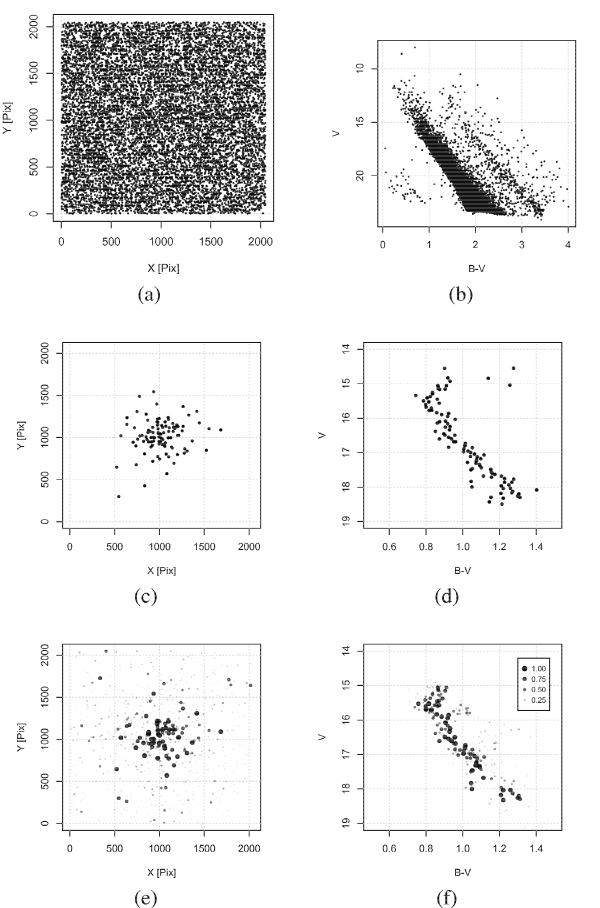
Results of UPMASK on a simulated cluster with 103M⊙ and 109.5 yr at 1.5 kpc. In a) and b) we plot the distribution of field+cluster stars in positional space and in V vs. (B − V) space. In c) and d) we show the distributions of cluster members only. In e) and f) we plot the distributions of the cluster members identified by UPMASK. Dot size and transparency encode membership probability.
Current usage metrics show cumulative count of Article Views (full-text article views including HTML views, PDF and ePub downloads, according to the available data) and Abstracts Views on Vision4Press platform.
Data correspond to usage on the plateform after 2015. The current usage metrics is available 48-96 hours after online publication and is updated daily on week days.
Initial download of the metrics may take a while.