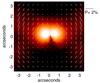
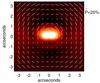
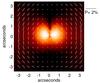
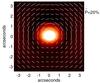
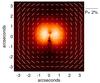
Fig. 2
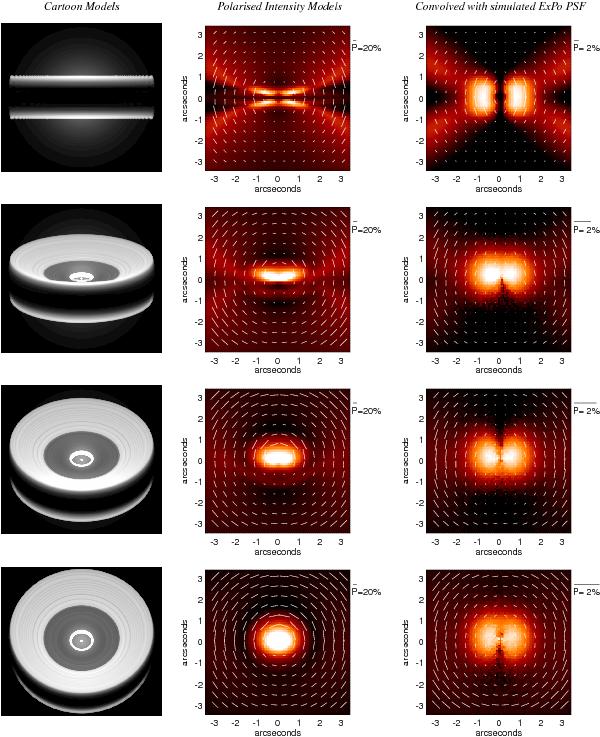
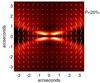
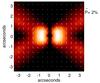
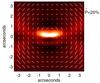
Models of the disk surrounding SU Aur showing the impact of inclination on the morphology of the disk images in linearly polarised light. From top to bottom, panels show a model inclination of i = 90°, i = 70°, i = 50°, and i = 30° respectively. The images in the left panels show the cartoon interpretation of the disk inclination, the images in the middle panels show the raw model images, and the images in the right panels are the polarised intensity models that have been convolved with a simulated ExPo PSF and processed through the ExPo data reduction pipeline. The intensity scale is logarithmic over two orders of magnitude and is the same as that of the ExPo images.


Current usage metrics show cumulative count of Article Views (full-text article views including HTML views, PDF and ePub downloads, according to the available data) and Abstracts Views on Vision4Press platform.
Data correspond to usage on the plateform after 2015. The current usage metrics is available 48-96 hours after online publication and is updated daily on week days.
Initial download of the metrics may take a while.