Fig. 6
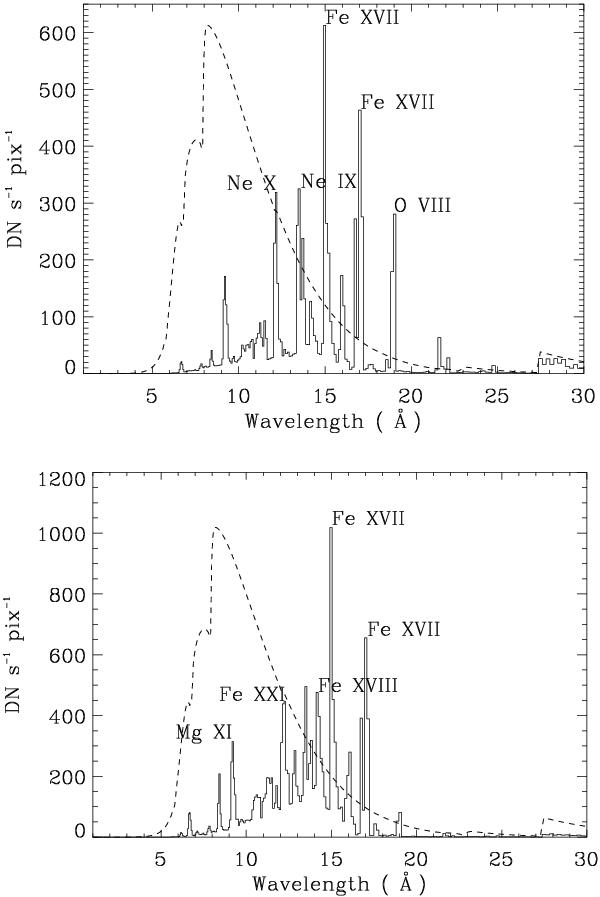
Top: active region synthetic spectrum for the Ti_poly filter using the photospheric abundances of Asplund et al. (2009). Bottom: flare synthetic spectrum for the Ti_poly filter using the coronal abundances of Feldman et al. (1992) and the “Flare 2” observation. The effective area is overplotted as a dashed line (scaled). The peak intensities of stronger lines are indicated.
Current usage metrics show cumulative count of Article Views (full-text article views including HTML views, PDF and ePub downloads, according to the available data) and Abstracts Views on Vision4Press platform.
Data correspond to usage on the plateform after 2015. The current usage metrics is available 48-96 hours after online publication and is updated daily on week days.
Initial download of the metrics may take a while.