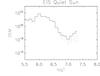
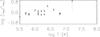
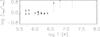
Fig. 4
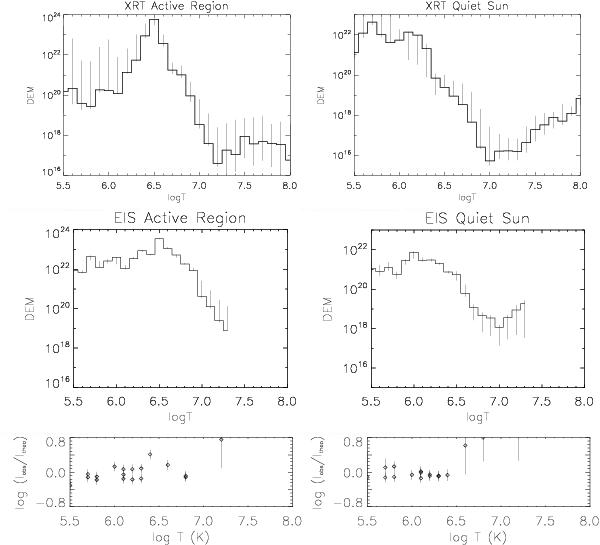
Top row: XRT DEM curves for the active region (left) and quiet Sun (right) areas shown in Fig. 1. Middle row: EIS DEM curves for the active region (left) and quiet Sun (right) areas. Bottom row: plots of the ratio of the observed intensity to the theoretical intensity for each spectral line used to constrain the corresponding EIS DEM curve. The error bars on the ratio correspond to a combination of the one-sigma uncertainties on the line fitting and an uncertainty of 22% on the observed intensity based on the pre-flight calibration of EIS (Lang et al. 2006).
Current usage metrics show cumulative count of Article Views (full-text article views including HTML views, PDF and ePub downloads, according to the available data) and Abstracts Views on Vision4Press platform.
Data correspond to usage on the plateform after 2015. The current usage metrics is available 48-96 hours after online publication and is updated daily on week days.
Initial download of the metrics may take a while.