Free Access
Fig. 1
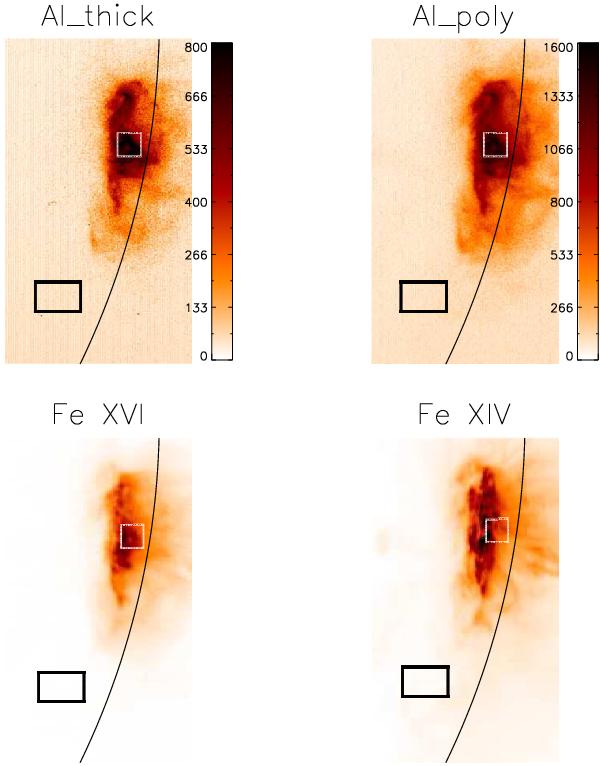
Top: XRT images observed with the Al_thick and Al_poly filters. Intensities are in units of DN pix-1. Bottom: EIS intensity maps of the Fe XVI 265.0 Å and Fe XIV 264.79 Å lines. The locations of the active region area (white box) and quiet Sun area (black box) are indicated. The position of the limb is also indicated.
Current usage metrics show cumulative count of Article Views (full-text article views including HTML views, PDF and ePub downloads, according to the available data) and Abstracts Views on Vision4Press platform.
Data correspond to usage on the plateform after 2015. The current usage metrics is available 48-96 hours after online publication and is updated daily on week days.
Initial download of the metrics may take a while.