Fig. 5
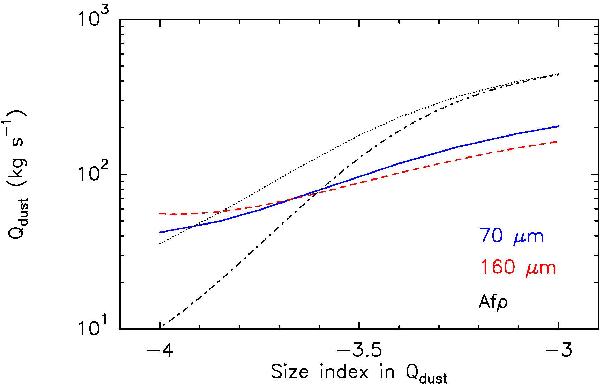
Dust production rates derived from the PACS 70 μm (blue curve) and 160 μm (red curve) maps of comet C/2012 S1 (ISON) obtained on March 13 2013 UT. The black curves show values derived from Afρ = 900 cm. Plain lines are for amin = 0.1 μm. Dashed lines are for amin = 1 μm. Refractive indices of olivine are used and we assumed QCO = 4 × 1027 molecules s-1.
Current usage metrics show cumulative count of Article Views (full-text article views including HTML views, PDF and ePub downloads, according to the available data) and Abstracts Views on Vision4Press platform.
Data correspond to usage on the plateform after 2015. The current usage metrics is available 48-96 hours after online publication and is updated daily on week days.
Initial download of the metrics may take a while.