Free Access
Fig. 7
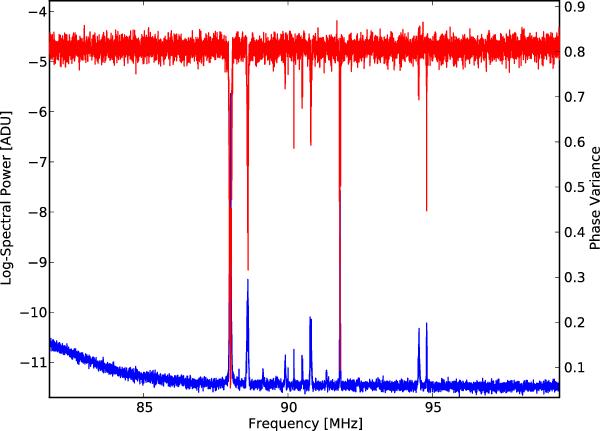
Average LBA spectrum (bottom, left axis) with the corresponding phase variance (top, right axis). RFI lines can clearly be identified in the phase variance with peaks toward lower values, representing more stable phase differences between antennas over time.
Current usage metrics show cumulative count of Article Views (full-text article views including HTML views, PDF and ePub downloads, according to the available data) and Abstracts Views on Vision4Press platform.
Data correspond to usage on the plateform after 2015. The current usage metrics is available 48-96 hours after online publication and is updated daily on week days.
Initial download of the metrics may take a while.