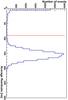
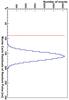
Fig. 17

Average residual delays derived from a plane-fit to data (top) and from random samples in the search window with respect to a horizontal shower front (bottom). The vertical line indicates the cut value derived from the simulated distribution, which is applied to the data.
Current usage metrics show cumulative count of Article Views (full-text article views including HTML views, PDF and ePub downloads, according to the available data) and Abstracts Views on Vision4Press platform.
Data correspond to usage on the plateform after 2015. The current usage metrics is available 48-96 hours after online publication and is updated daily on week days.
Initial download of the metrics may take a while.