Fig. 9
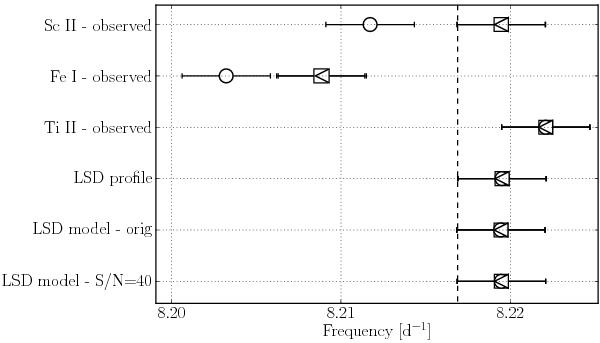
Comparison of the frequencies extracted from the three different spectral lines in the original observed spectra of 20 CVn with the values deduced from the LSD-based model spectra (for the Sc II 5239 Å only, based on the data sets characterized by different S/N) and from the LSD profiles themselves. The symbols refer to the three observables used for the analysis: the first- and third-order moments (squares and circles, respectively), and the profiles themselves (triangles). The frequency errors are assumed to correspond to the Rayleigh limit of the data. The vertical dashed line represents the literature value of 8.2168 d-1 (Rodriguez et al. 1998).
Current usage metrics show cumulative count of Article Views (full-text article views including HTML views, PDF and ePub downloads, according to the available data) and Abstracts Views on Vision4Press platform.
Data correspond to usage on the plateform after 2015. The current usage metrics is available 48-96 hours after online publication and is updated daily on week days.
Initial download of the metrics may take a while.