Free Access
Fig. 2
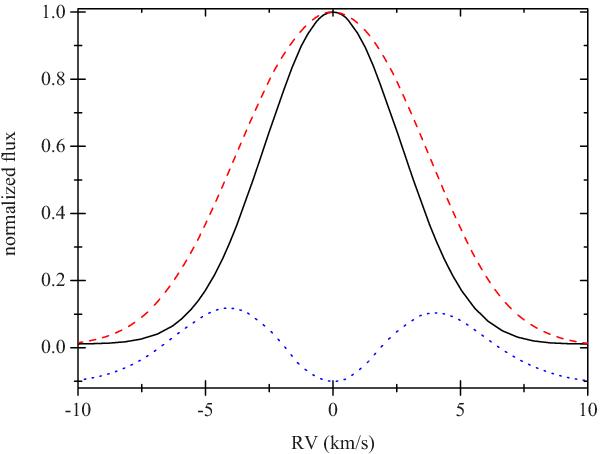
LSD profiles computed for two different groups of spectral lines: with relative strengths <0.4 (solid, black line) and >0.4 (dashed, red line). The difference between the two profiles (dotted, blue line) is shown at the bottom and was shifted in Y by value of –0.1 for clarity.
Current usage metrics show cumulative count of Article Views (full-text article views including HTML views, PDF and ePub downloads, according to the available data) and Abstracts Views on Vision4Press platform.
Data correspond to usage on the plateform after 2015. The current usage metrics is available 48-96 hours after online publication and is updated daily on week days.
Initial download of the metrics may take a while.