Fig. 10
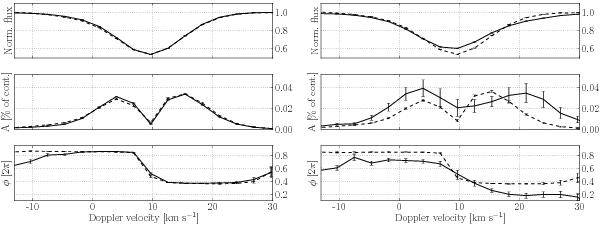
Results of the frequency analysis of Sc II 5239 Å line in the spectra of 20 CVn by means of the pixel-by-pixel method. The two panels represent the original data (left) and the simulated data set characterized by S/N of 40 (right). Each panel illustrates the mean profile (top), and the amplitude and phase across this profile (middle and bottom, respectively). The solid and dashed lines represent the original observed and the LSD-based model spectra, respectively. The corresponding error margins are shown by the bars. The results are shown for the dominant (radial) mode of ~8.22 d-1 (95.11 μHz).
Current usage metrics show cumulative count of Article Views (full-text article views including HTML views, PDF and ePub downloads, according to the available data) and Abstracts Views on Vision4Press platform.
Data correspond to usage on the plateform after 2015. The current usage metrics is available 48-96 hours after online publication and is updated daily on week days.
Initial download of the metrics may take a while.