Fig. 8
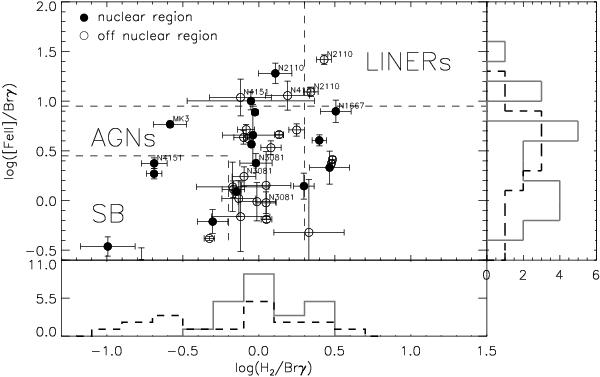
NIR diagnostic diagram, adapted from Larkin et al. (1998) and Rodríguez-Ardila et al. (2004, 2005). The different domains of the plot, labelled “SB” (starburst), “AGN” and “LINERs” have been shown to provide a basic classification of galactic nuclei. We only plot the result for those apertures where we had significant line detections in all three lines. The side panels show the distributions of the two ratios, differentiated by nuclear (black, dashed) and off-nuclear (gray, solid) environment.
Current usage metrics show cumulative count of Article Views (full-text article views including HTML views, PDF and ePub downloads, according to the available data) and Abstracts Views on Vision4Press platform.
Data correspond to usage on the plateform after 2015. The current usage metrics is available 48-96 hours after online publication and is updated daily on week days.
Initial download of the metrics may take a while.