Fig. 2
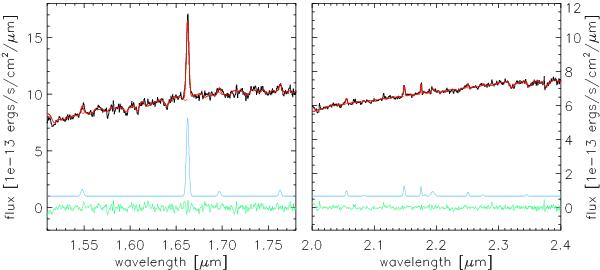
Example of the spectral fitting with the pPXF and GANDALF routines. These H- (left) and K-band (right) spectra are from the nucleus of NGC 2110 (0.65′′ aperture). The black line represents the observed spectrum and the red line the best-fit returned by pPXF + GANDALF. This fit includes both the composite stellar spectrum and emission lines. The green line shows the residual (observation − fit). The blue line shows the combined emission line fit. This line has been offset from zero for better display. Shown is one spatial position, each spatial position in the H- and K-band spectra was fitted independently. A color version of this figure is available in the online journal.
Current usage metrics show cumulative count of Article Views (full-text article views including HTML views, PDF and ePub downloads, according to the available data) and Abstracts Views on Vision4Press platform.
Data correspond to usage on the plateform after 2015. The current usage metrics is available 48-96 hours after online publication and is updated daily on week days.
Initial download of the metrics may take a while.