Free Access
Fig. 7
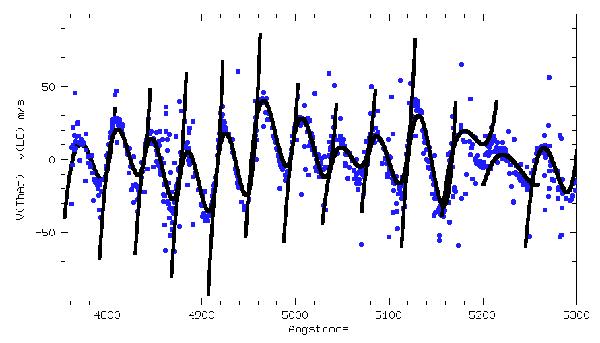
Wavelength difference between the lines of the LFC spectrum when calibrated with Th-Ar: the blue CCD. The difference here is performed in the non merged orders. The orders are easily identified since at the edges large deviations are observed. The points of Fig. 4 based on the solar lines are over-plotted.
Current usage metrics show cumulative count of Article Views (full-text article views including HTML views, PDF and ePub downloads, according to the available data) and Abstracts Views on Vision4Press platform.
Data correspond to usage on the plateform after 2015. The current usage metrics is available 48-96 hours after online publication and is updated daily on week days.
Initial download of the metrics may take a while.