Free Access
Fig. 9
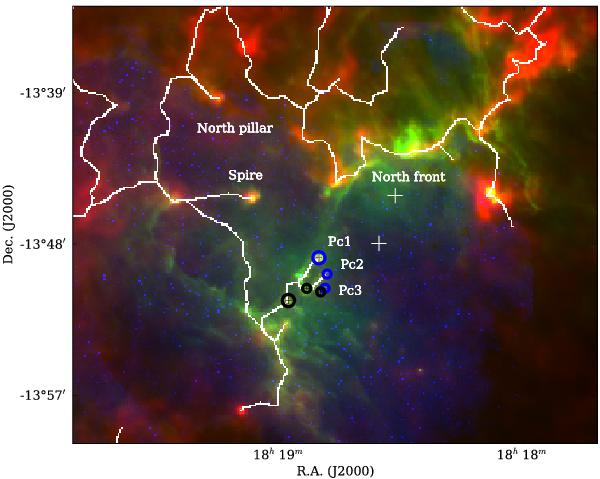
Three-colour image of the interface between the Eagle Nebula and the H ii region around NGC 6611 (red: Herschel column density map, green: PACS 70 μm, blue: Hα). The white crosses indicate the O stars. Each spectrum in Fig. 10 is integrated inside the corresponding coloured circle.
Current usage metrics show cumulative count of Article Views (full-text article views including HTML views, PDF and ePub downloads, according to the available data) and Abstracts Views on Vision4Press platform.
Data correspond to usage on the plateform after 2015. The current usage metrics is available 48-96 hours after online publication and is updated daily on week days.
Initial download of the metrics may take a while.