Free Access
Fig. 15
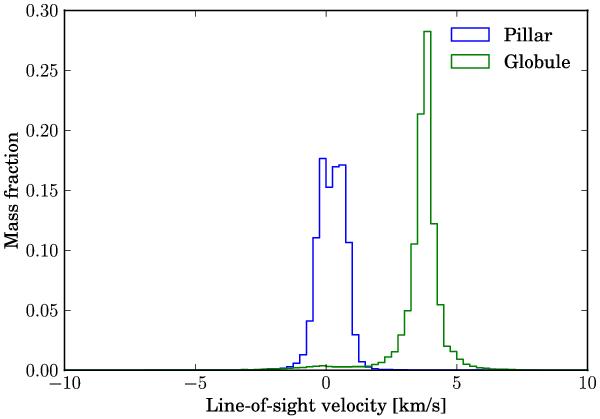
Distribution of the gas mass as a function of the line-of-sight velocity for a pillar in the Mach-1 simulation and for a globule in the Mach-4 simulation (see Tremblin et al. 2012b, for the details of the numerical setup). Snapshots of the Mach 1 and Mach 4 simulations are in Fig. 11).
Current usage metrics show cumulative count of Article Views (full-text article views including HTML views, PDF and ePub downloads, according to the available data) and Abstracts Views on Vision4Press platform.
Data correspond to usage on the plateform after 2015. The current usage metrics is available 48-96 hours after online publication and is updated daily on week days.
Initial download of the metrics may take a while.