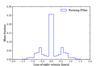
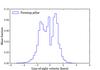
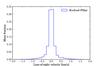
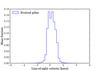
Fig. 14

Distribution of the gas mass as a function of the line-of-sight velocity for the snapshots in Fig. 13. Top: the spectra are taken when the pillar is forming and the shell curved, just before the shell has collapsed in on itself. The blue- and red-shifted components can be clearly identified in both cases and are associated with the curved shell. Bottom: after the collapse, when the pillar is in its growing state, the spectra display a single peak.
Current usage metrics show cumulative count of Article Views (full-text article views including HTML views, PDF and ePub downloads, according to the available data) and Abstracts Views on Vision4Press platform.
Data correspond to usage on the plateform after 2015. The current usage metrics is available 48-96 hours after online publication and is updated daily on week days.
Initial download of the metrics may take a while.