Fig. 13
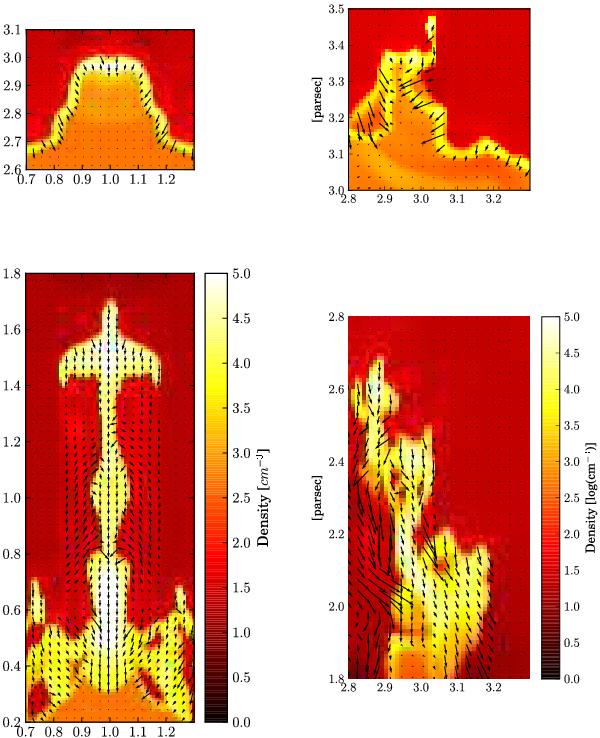
Density cut of the formation of a pillar in an idealized simulation of a clump embedded in a homogeneous medium (left: Tremblin et al. 2012a) and in a turbulent medium at Mach 1 (right: Tremblin et al. 2012b). The black arrows represent the velocity field of the neutral gas. The compressed layer can be identified with the velocity field and the high density (around 104 cm-3 in yellow). Top: the snapshots are taken when the pillar is forming, just before the compressed layer has collapsed in on itself. The high curvature of the compressed layer can be clearly identified in both cases. Bottom: after the shell has collapsed, the pillars are formed.
Current usage metrics show cumulative count of Article Views (full-text article views including HTML views, PDF and ePub downloads, according to the available data) and Abstracts Views on Vision4Press platform.
Data correspond to usage on the plateform after 2015. The current usage metrics is available 48-96 hours after online publication and is updated daily on week days.
Initial download of the metrics may take a while.