Free Access
Fig. 12
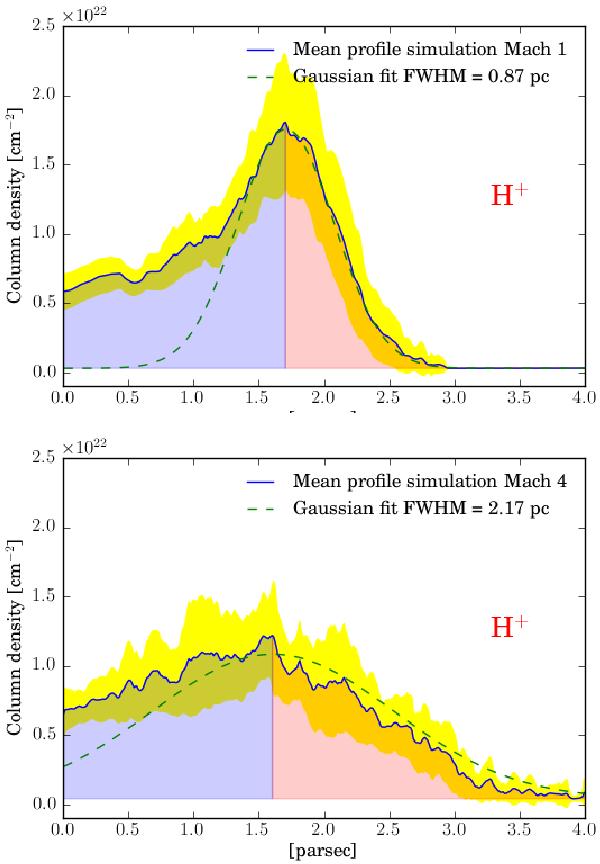
Column density profiles of the two simulations shown in Fig. 11 after 1 My. The red sign H+ indicates the position of the ionized gas in the simulation. The flux is coming from the right side of the profiles.
This figure is made of several images, please see below:
Current usage metrics show cumulative count of Article Views (full-text article views including HTML views, PDF and ePub downloads, according to the available data) and Abstracts Views on Vision4Press platform.
Data correspond to usage on the plateform after 2015. The current usage metrics is available 48-96 hours after online publication and is updated daily on week days.
Initial download of the metrics may take a while.