Fig. 6
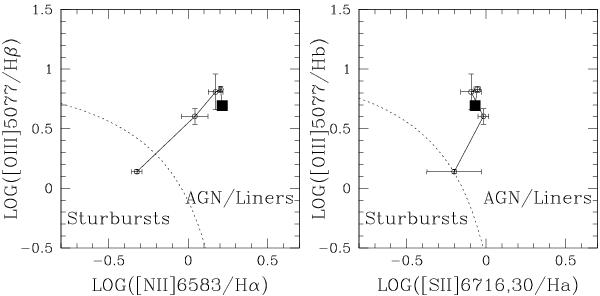
The BPT diagnostic diagrams from the emission line ratios measured along the minor axis of IC 5181. The radial bins are the same as in Fig. 5. The larger squares mark the values measured in the central radial bin. The solid line connects the measurements from the central to the outermost radial bin. The dotted lines separate the regions occupied by starbursts and AGN/Liners and are taken from Kewley et al. (2001).
Current usage metrics show cumulative count of Article Views (full-text article views including HTML views, PDF and ePub downloads, according to the available data) and Abstracts Views on Vision4Press platform.
Data correspond to usage on the plateform after 2015. The current usage metrics is available 48-96 hours after online publication and is updated daily on week days.
Initial download of the metrics may take a while.