Fig. 5
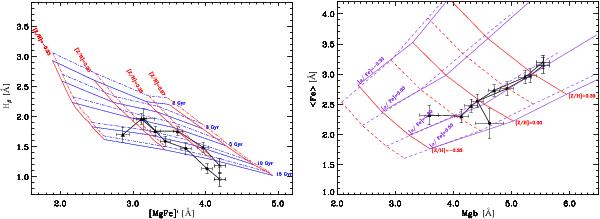
Hβ and [MgFe]′ indices (left panel) and ⟨ Fe ⟩ and Mgb indices (right panel) measured along the major (triangles) and minor axis (circles). The open symbols correspond to the values measured in the center of the galaxy and the black lines connect values measured in adjacent radial bins. The radial bins are centered at  , and
, and  along the major axis and at
  and
and  along the minor axis. The grids indicate the models by Thomas et al. (2003). In the left panel the age-metallicity grids are plotted with two different [α/Fe] enhancements: [α/Fe] = 0.0 dex (solid lines) and [α/Fe] = 0.5 dex (dashed lines). In the right panel the [α/Fe] ratio-metallicity grids are plotted with two different ages: 8 Gyr (solid lines) and 12 Gyr (dashed lines).
Current usage metrics show cumulative count of Article Views (full-text article views including HTML views, PDF and ePub downloads, according to the available data) and Abstracts Views on Vision4Press platform.
Data correspond to usage on the plateform after 2015. The current usage metrics is available 48-96 hours after online publication and is updated daily on week days.
Initial download of the metrics may take a while.