Fig. 5
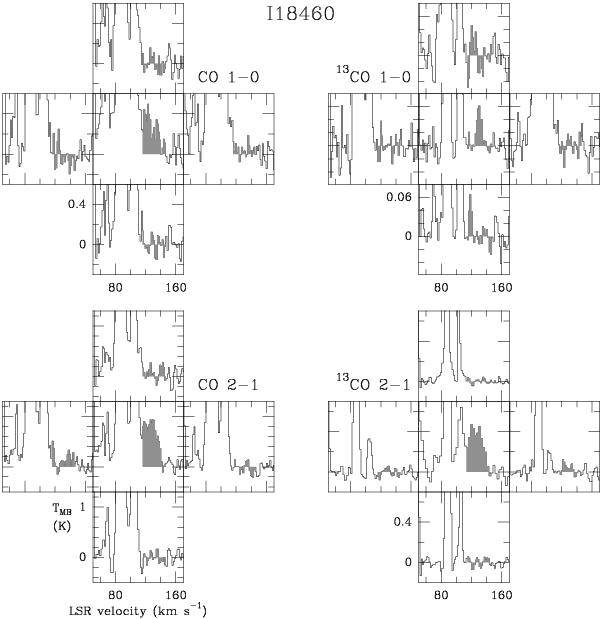
All spectra observed towards IRAS 18460+0151. Each cross of five spectra corresponds to one of the CO lines. The relative locations of the spectra indicate the relative positions of antenna pointings; the centre towards the WF and four offset positions, 24′′ away from the WF. The lines are indicated on top of each cross. The velocity range from 115 to 145 km s-1 has been shaded to facilitate additional comparison. As discussed in the text, this velocity range depicts significant emission only at the star position.
Current usage metrics show cumulative count of Article Views (full-text article views including HTML views, PDF and ePub downloads, according to the available data) and Abstracts Views on Vision4Press platform.
Data correspond to usage on the plateform after 2015. The current usage metrics is available 48-96 hours after online publication and is updated daily on week days.
Initial download of the metrics may take a while.