Fig. 1
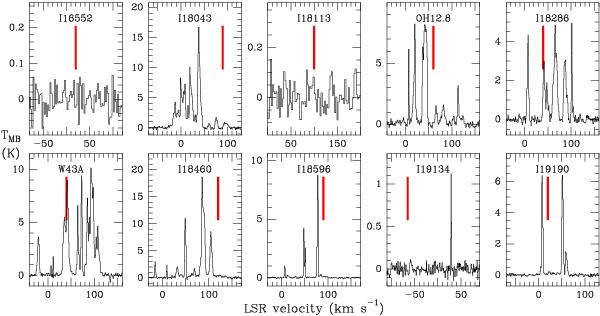
CO J = 1 → 0 spectra towards the ten WFs surveyed. The (shortened) source name is indicated at the top of each spectrum. Note the different intensity ranges in the panels. All the spectra span 200 km s-1 of coverage to facilitate line width comparisons among the sources. Spectra corresponding to IRAS 16552-3050 and IRAS 18113-2503 have been smoothed to three times the original velocity spacing. Red vertical bars are located at approximately the stellar velocity to facilitate additional association. Most of these velocity components arise from background or foreground Galactic clouds, as discussed in the text.
Current usage metrics show cumulative count of Article Views (full-text article views including HTML views, PDF and ePub downloads, according to the available data) and Abstracts Views on Vision4Press platform.
Data correspond to usage on the plateform after 2015. The current usage metrics is available 48-96 hours after online publication and is updated daily on week days.
Initial download of the metrics may take a while.