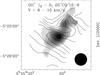
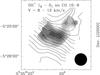
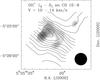
Fig. 2

Spatial distribution of the OH+ 12–01 emission, integrated between VLSR = +6 and +10 km s-1 (top), between +8 and +12 km s-1 (middle), and between +10 and +14 km s-1 (bottom). Greyscale levels start at 0.6 K km s-1 and increase by 0.2 K km s-1. Contours of CO 10–9 emission are at 5, 15, ... 95% of the peak intensity in the respective velocity channel. Vibrationally excited H2 peaks near the north-west edge of the CO emission (cf. Fig. 1 of Nagy et al. 2013).
Current usage metrics show cumulative count of Article Views (full-text article views including HTML views, PDF and ePub downloads, according to the available data) and Abstracts Views on Vision4Press platform.
Data correspond to usage on the plateform after 2015. The current usage metrics is available 48-96 hours after online publication and is updated daily on week days.
Initial download of the metrics may take a while.