Fig. 8
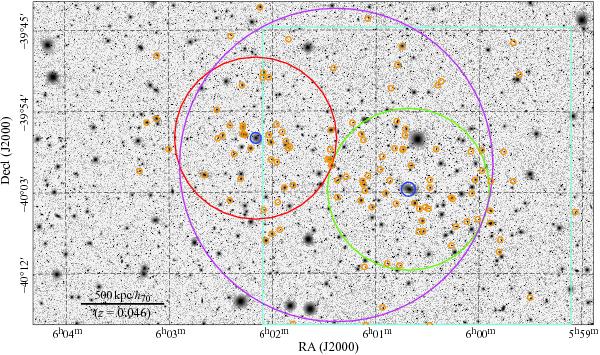
B band image of Abell 3376. The three large circles are those where the GLF was extracted: the whole cluster in the magenta circle, the BCG1 region in the green circle, and the BCG2 region in the red circle (see text). The two brightest galaxies are indicated with blue circles (BCG1, considered as the cluster center, is to the west, and BCG2 corresponds to the zone of maximum X-ray emission). The galaxies with spectroscopic redshifts in the cluster range are marked in orange. The cyan rectangle shows the field covered by the WINGS catalogue in the B and V bands. The total image size is 1.03 × 0.59 deg2. North is up and east to the left.
Current usage metrics show cumulative count of Article Views (full-text article views including HTML views, PDF and ePub downloads, according to the available data) and Abstracts Views on Vision4Press platform.
Data correspond to usage on the plateform after 2015. The current usage metrics is available 48-96 hours after online publication and is updated daily on week days.
Initial download of the metrics may take a while.