Free Access
Fig. 6
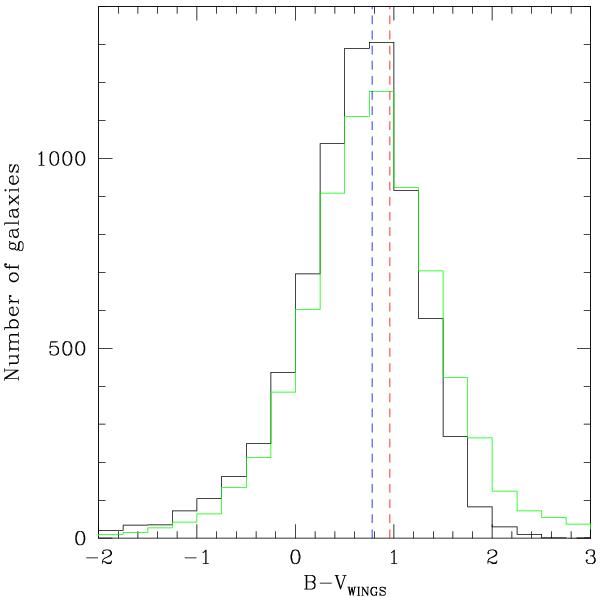
Histogram of the (B − V) colour computed with our B band data (black line) and with the B band WINGS catalogue (green line), with V magnitudes taken from WINGS. Average colours for a Sab and an elliptical galaxy (taken from Fukugita et al. 1995) are indicated in blue and red, respectively.
Current usage metrics show cumulative count of Article Views (full-text article views including HTML views, PDF and ePub downloads, according to the available data) and Abstracts Views on Vision4Press platform.
Data correspond to usage on the plateform after 2015. The current usage metrics is available 48-96 hours after online publication and is updated daily on week days.
Initial download of the metrics may take a while.