Fig. 12
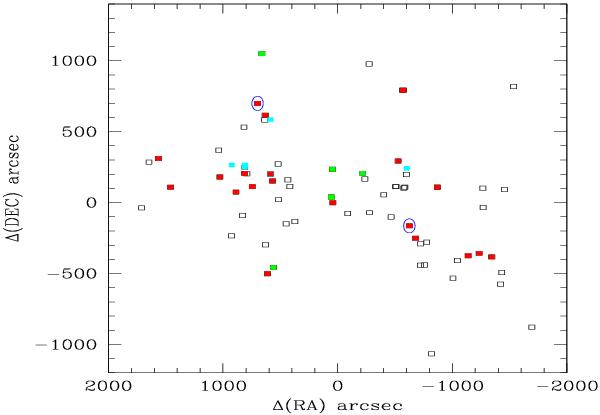
Positions of the structures detected by the SG method. The main structure (S1, 82 galaxies) is shown as black open squares, and includes two smaller structures, S1a and S1b, of 25 and six galaxies respectively, shown in red and green. A second independent structure of six galaxies (S2) is shown in cyan. The axes correspond to the right ascension and declination offsets (in arcseconds) relative to the position of the center of the magenta circle (90.346 deg, −40.0 deg). The two blue circles show the positions of BCG1 (west) and BCG2 (east).
Current usage metrics show cumulative count of Article Views (full-text article views including HTML views, PDF and ePub downloads, according to the available data) and Abstracts Views on Vision4Press platform.
Data correspond to usage on the plateform after 2015. The current usage metrics is available 48-96 hours after online publication and is updated daily on week days.
Initial download of the metrics may take a while.