Fig. 11
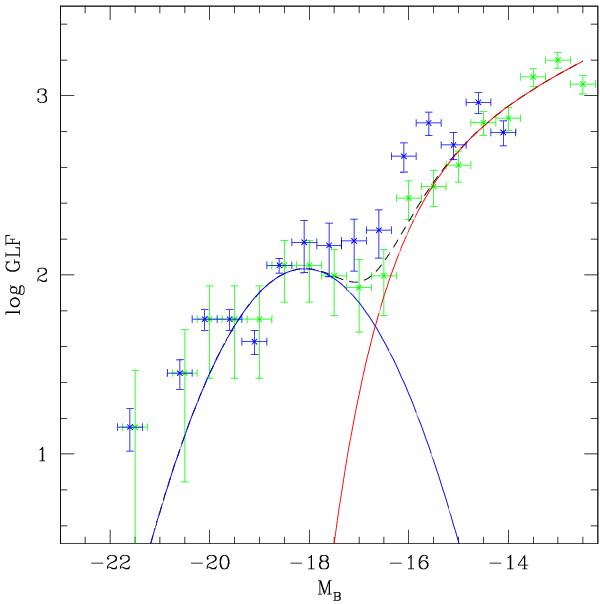
GLF in the B band for the BCG1 region of Abell 3376, obtained by selecting galaxies along the red sequence in a (B − V) versus V colour–magnitude diagram (green points). The units are galaxy counts in bins of 0.5 magnitude and per square degree. The best fit is obtained by summing a Gaussian (in blue) at the bright end, and a Schechter function (in red) at the faint end; their sum is shown as a black dashed line. The GLF obtained by statistical subtraction in the same region is shown as blue points, displaced by −0.1 mag to avoid overlapping.
Current usage metrics show cumulative count of Article Views (full-text article views including HTML views, PDF and ePub downloads, according to the available data) and Abstracts Views on Vision4Press platform.
Data correspond to usage on the plateform after 2015. The current usage metrics is available 48-96 hours after online publication and is updated daily on week days.
Initial download of the metrics may take a while.