Fig. 10
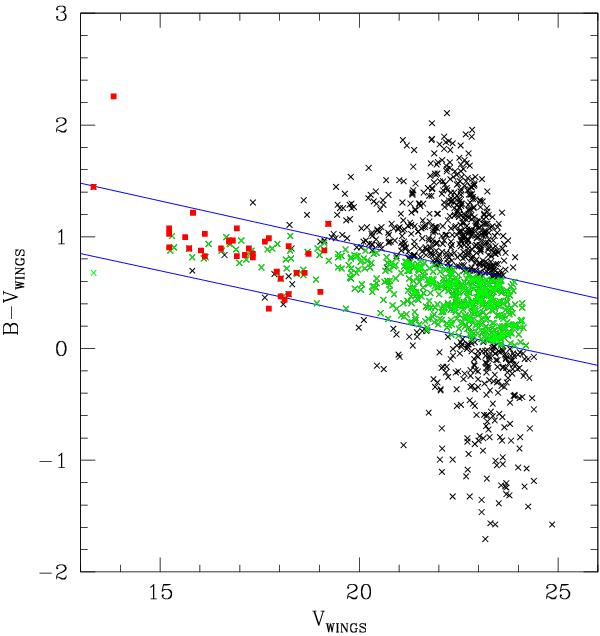
(B − V) versus V colour–magnitude diagram for the BCG1 region of Abell 3376. Black crosses show all the galaxies, red squares show the galaxies with spectroscopic redshifts in the cluster, and green squares show all the galaxies selected as cluster members within the red sequence delimited by the two blue lines (see text). The (few) black crosses within the red sequence have spectroscopic redshifts outside the cluster and thus were not taken into account to compute the GLF.
Current usage metrics show cumulative count of Article Views (full-text article views including HTML views, PDF and ePub downloads, according to the available data) and Abstracts Views on Vision4Press platform.
Data correspond to usage on the plateform after 2015. The current usage metrics is available 48-96 hours after online publication and is updated daily on week days.
Initial download of the metrics may take a while.