Free Access
Fig. 6
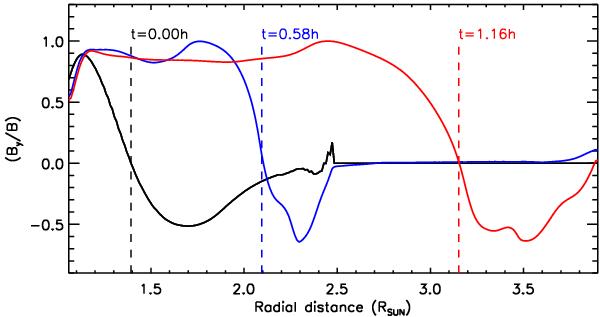
Profile of Bθ/|B | above the centre of the LHS bipole, at different times (different colours). Dashed lines of different colours indicate where Bθ/|B| = 0 and where we locate the top of the flux rope at a given time.
Current usage metrics show cumulative count of Article Views (full-text article views including HTML views, PDF and ePub downloads, according to the available data) and Abstracts Views on Vision4Press platform.
Data correspond to usage on the plateform after 2015. The current usage metrics is available 48-96 hours after online publication and is updated daily on week days.
Initial download of the metrics may take a while.