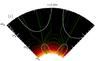
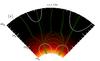
Fig. A.1
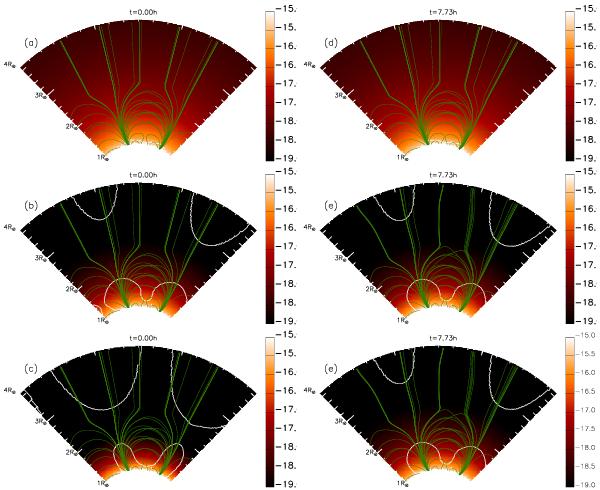
Maps of log10(ρ [g/cm3]) in the (r−φ) plane passing through the centre of the bipoles at different times for different test simulations. Superimposed are magnetic field lines plotted from the same starting points (green lines) and the contour line of β = 1 (white line). a) and d)T = 3 MK, Bmax = 7 G; b) and e)T = 2 MK, Bmax = 21 G; c) and f)T = 1.5 MK, Bmax = 42 G.


Current usage metrics show cumulative count of Article Views (full-text article views including HTML views, PDF and ePub downloads, according to the available data) and Abstracts Views on Vision4Press platform.
Data correspond to usage on the plateform after 2015. The current usage metrics is available 48-96 hours after online publication and is updated daily on week days.
Initial download of the metrics may take a while.