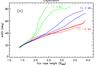
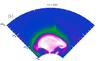
Fig. 10

a) Angular extension of the flux rope as a function of the radial distance of the top of the flux rope for all the simulations that show a CME. Simulations are grouped according to the simulation parameter T given with different colours. b) Map of Bθ/|B | in the (r−φ) plane passing through the centre of the bipoles at t = 1.55 h for the simulation with T = 3 MK and Bmax = 21 G. The map shows the full domain of our simulations from r = 1 R⊙ to r = 4 R⊙.
Current usage metrics show cumulative count of Article Views (full-text article views including HTML views, PDF and ePub downloads, according to the available data) and Abstracts Views on Vision4Press platform.
Data correspond to usage on the plateform after 2015. The current usage metrics is available 48-96 hours after online publication and is updated daily on week days.
Initial download of the metrics may take a while.