Fig. 1
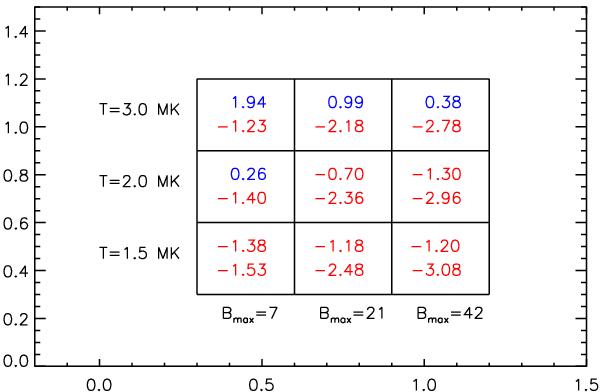
Grid summarizing the parameter space we investigate. We ran 9 simulations with all the combinations of T = 1.5, 2, 3 MK with Bmax = 7, 21, 42 G. The numbers in the cell represent the log10(β) at the lower boundary (lower number) and the log10(β) at the upper boundary (higher number). Red are negative values, and blue positive ones.
Current usage metrics show cumulative count of Article Views (full-text article views including HTML views, PDF and ePub downloads, according to the available data) and Abstracts Views on Vision4Press platform.
Data correspond to usage on the plateform after 2015. The current usage metrics is available 48-96 hours after online publication and is updated daily on week days.
Initial download of the metrics may take a while.